PRTOTYPE.COM · Production studioAudit · Build · Maintain
PRoTOTYPE.COM
Case study · Live demonstrator

Every token, accounted for.

The Token-Spend Toolkit is financial control for LLM usage across Claude and ChatGPT: one normalised data layer, seven focused tools over it, and a Monday-morning briefing that already contains the numbers and the recommended move, before the invoice arrives.
Type
Spend analytics · Python
Data layer
DuckDB + Parquet
Status
Live · board-signed v1
$0.000001 max cost drift
204 tests pin every figure
token-spend-toolkit.prtotype.com
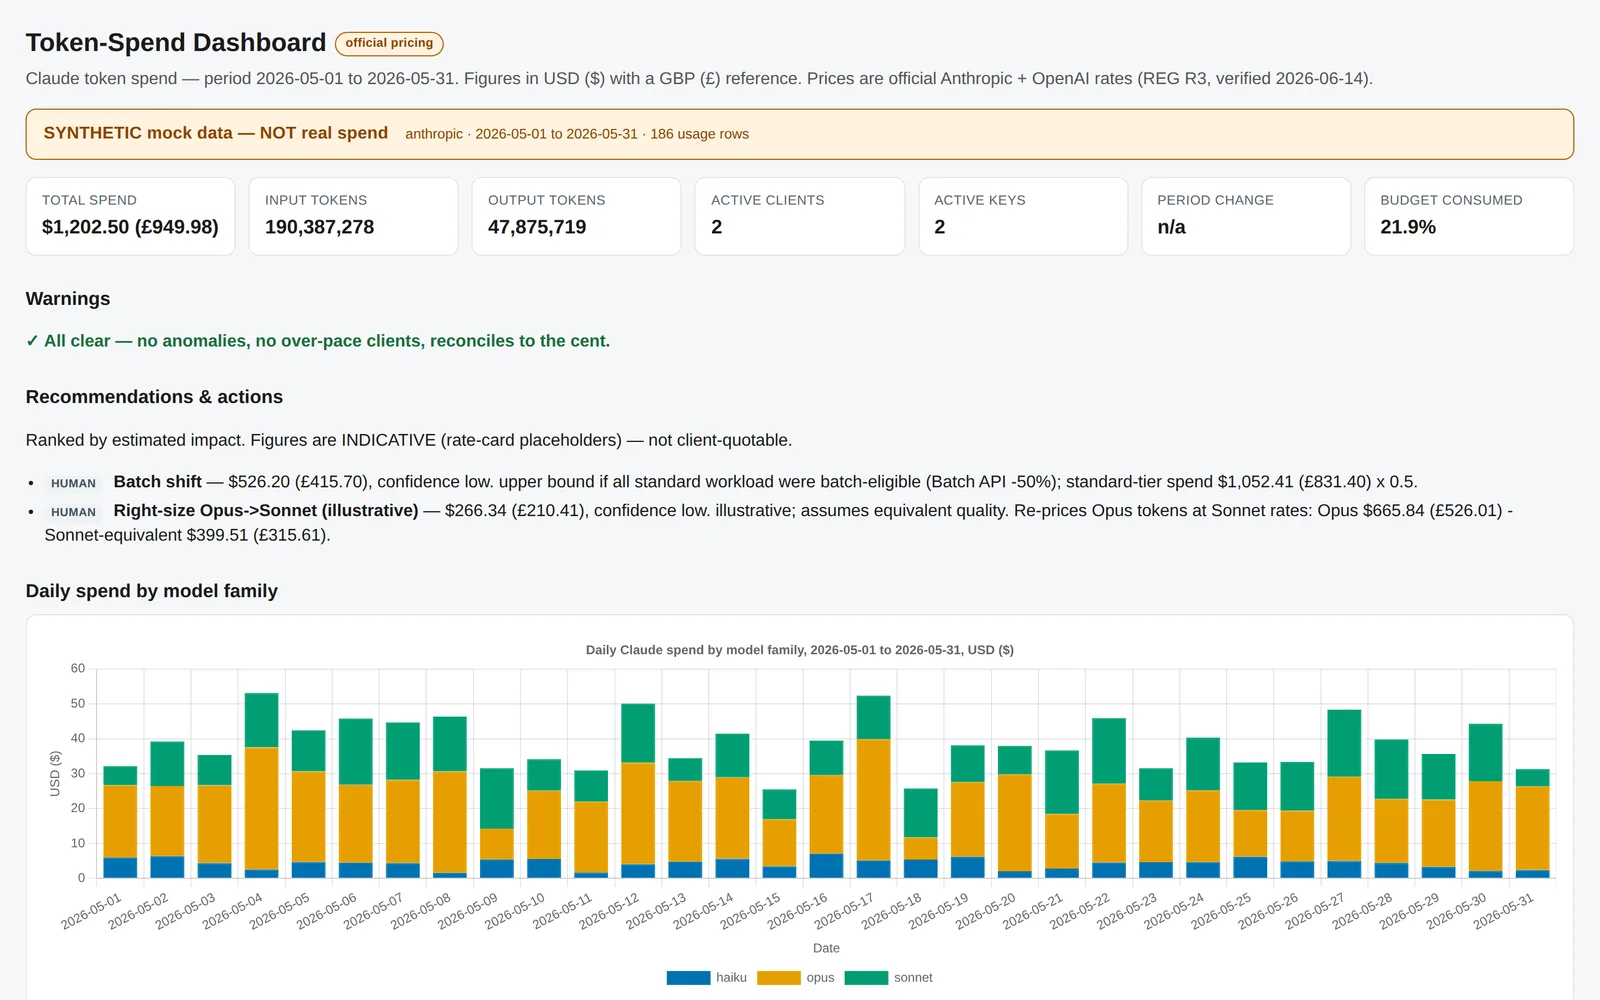
Token-Spend Toolkit Command Centre dashboard
The brief

One bill, two providers, zero warning.

Teams buying Anthropic and OpenAI capacity share the same blind spot: the bill arrives after the fact, aggregated into consoles nobody watches. Usage sits in two shapes with no unified view, no forecast, no alerting, and no link from a number to an action.

The toolkit’s premise: financial control of LLM usage. Ingest normalises both providers into one canonical store; forecast flags over-pace clients mid-month; the anomaly detector separates genuine spikes from noise; the actions layer ranks what to do next with dollar impact attached. Catch a runaway loop in hours, not at invoice time.

Built under a governed delivery plan: seven milestones independently signed off, then an adversarial audit whose eight findings were fixed, re-gated and covered by new tests before v1 was signed.

“Unknown models raise instead of costing $0. Bad data fails loud rather than quietly lying.”
$1,202.50
Canonical fixture, to the cent
204
Tests passing · 2 skip without keys
7
Tools over one data layer
$0.000001
Max drift vs provider-reported cost
100%
Deterministic byte-identical output
The product

A briefing that reads like evidence.

Instrument Serif headlines, warm paper, a money-green-and-amber palette: the Command Centre looks like a beautifully typeset audit report, because that is what it is. A tour of what an operator actually sees.
Command Centre · headline figures
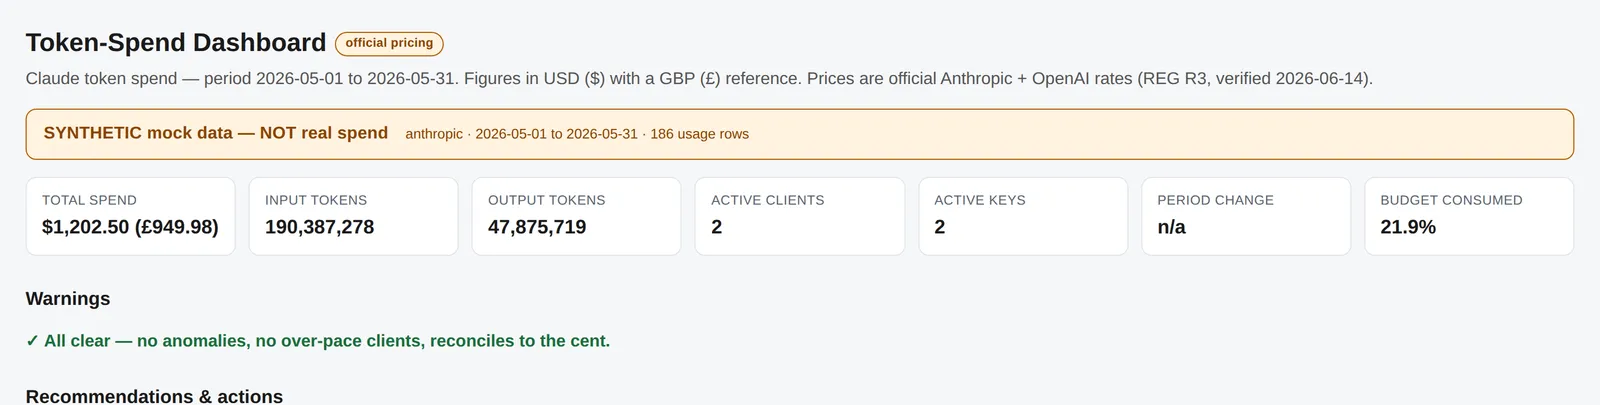
KPI band of the Command Centre
01 / The KPI band

The numbers, first.

Month-to-date spend, projection, budget consumption and anomalies lead the page. Every figure carries its period and its unit so a chart can never be read out of context, and money renders as $1,202.50 (£949.98): USD with a GBP reference sourced from the rate card, never a hardcoded constant.
Period + unit on every figureUSD + £ referenceProvenance line
Command Centre · daily chart
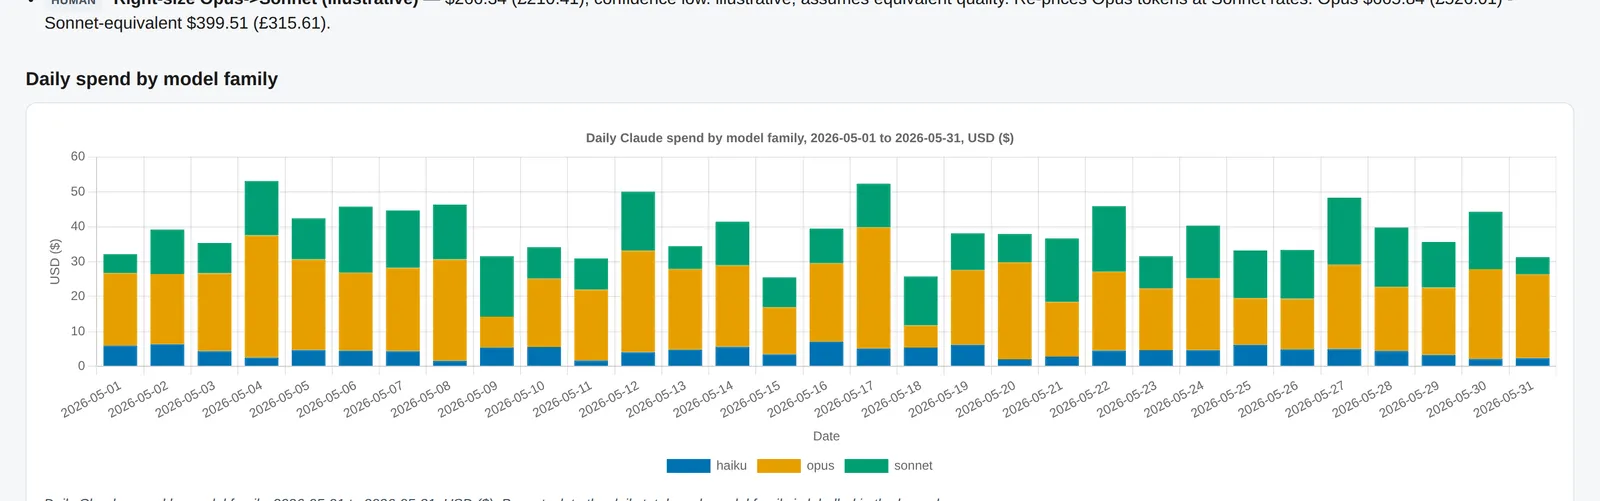
Daily spend trend chart
02 / Daily spend trend

The month, day by day.

Daily cost across providers and model families on one timeline. The palette is Okabe-Ito colour-blind safe and every series is also labelled in the legend, so meaning never rides on colour alone. Chart.js is pinned and integrity-locked with a Subresource Integrity hash.
Okabe-Ito paletteLabelled seriesSRI-pinned CDN script
Command Centre · budget panel
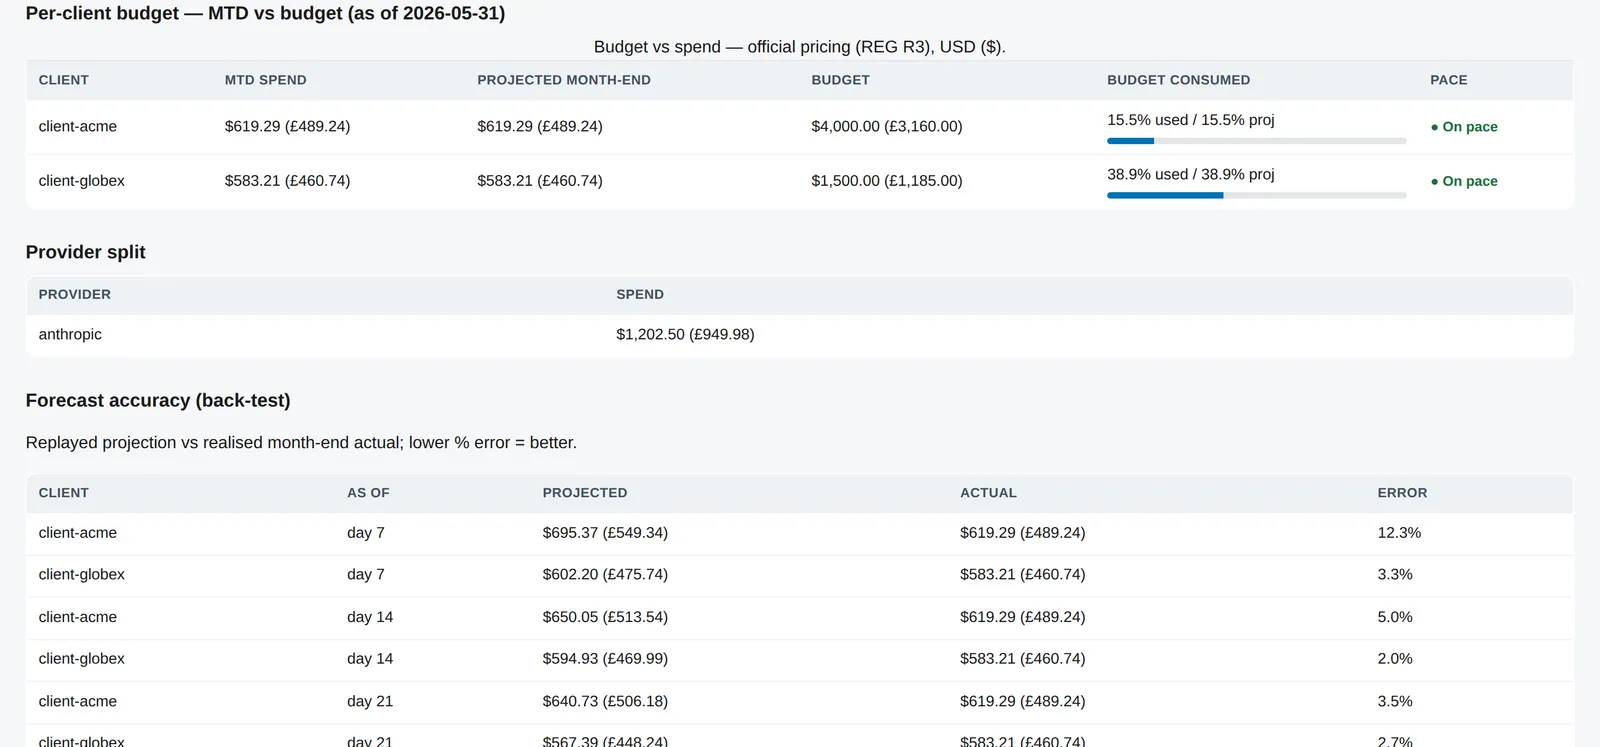
Budget and efficiency panel
03 / Budgets at pace

Over pace, flagged mid-month.

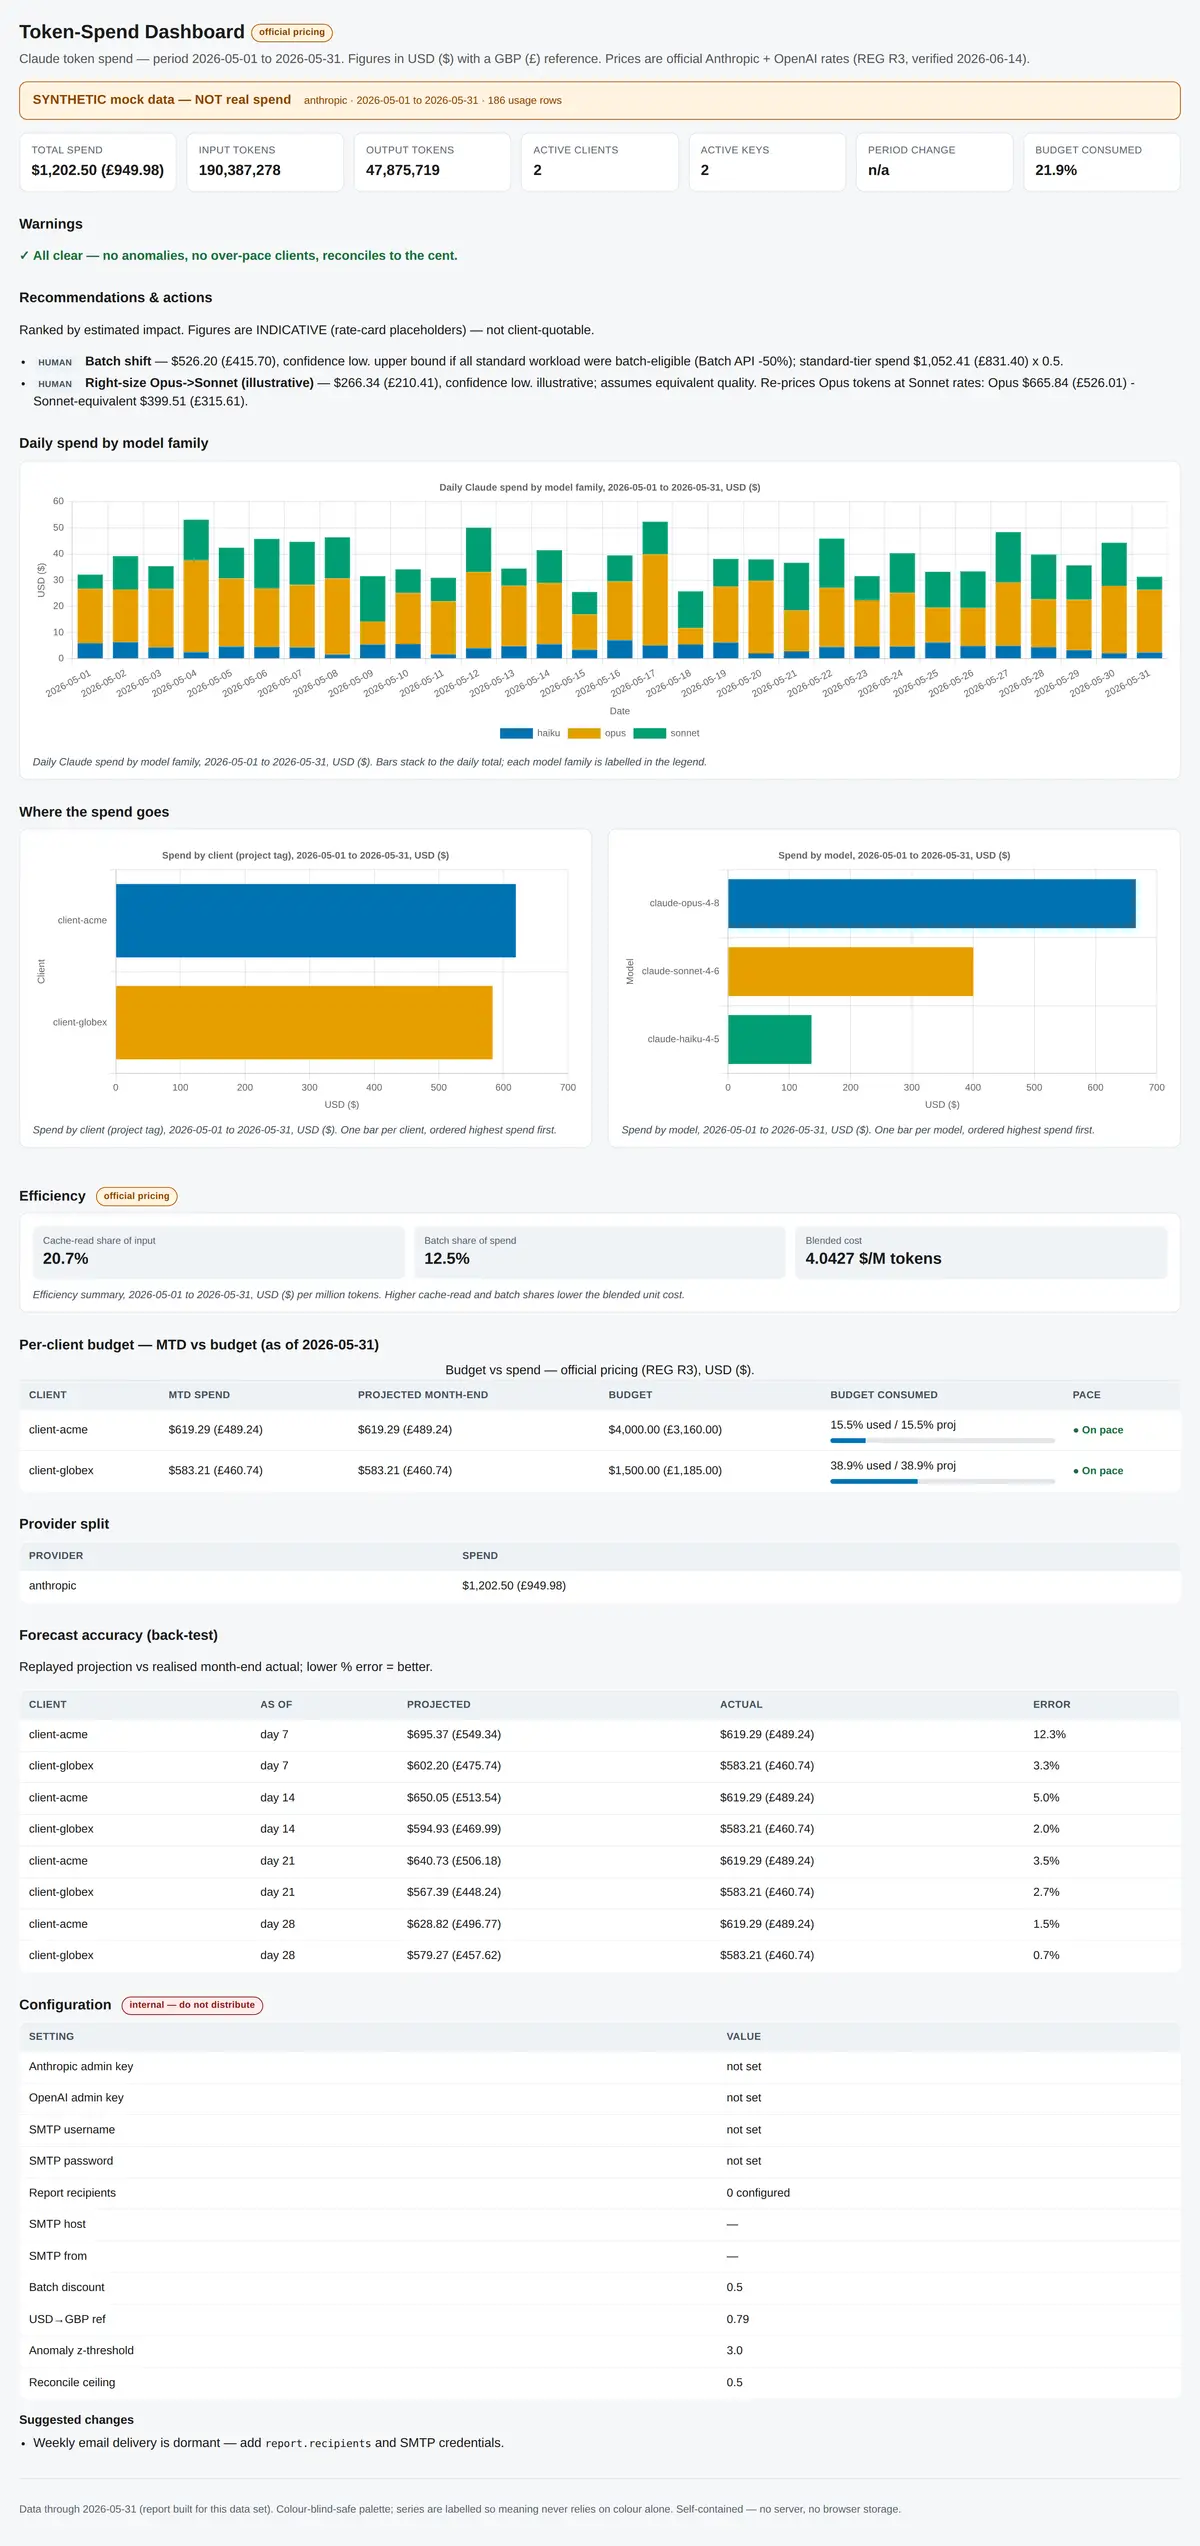
Per-client budgets against month-to-date reality, with the projection extrapolated over each client's active days rather than the calendar, so a client that started on the 20th is judged fairly. Projected overage flows verbatim into the actions layer: one chain of custody, no recomputed drift.
Active-day projectionOver-pace flagsVerbatim impact figures
dashboard.html · self-contained
Full Command Centre page, end to end
04 / The whole board

One page, end to end.

The entire Command Centre is a single HTML file: no server, no build step, data embedded as JSON, opens in any browser. Secrets appear only as presence indicators; key values are structurally incapable of reaching the rendered page.

Single HTML fileNo server, no build stepPresence-only secrets
Under the surface

Rigour usually reserved for regulated software.

The discipline a finance team never notices but always benefits from: correctness, honesty and resilience enforced in code rather than promised in documentation.

Leave-one-out baseline

The day under test is excluded from its own mean and deviation, so a huge spike cannot inflate the statistics and mask itself.

Anomaly detector

Independent reconciliation

Billed and computed costs sit side by side in every row, so a price change overnight or a parsing bug exposes itself as measurable drift.

Two cost fields

Fail-loud validation

Unknown models raise instead of costing $0. Collisions raise instead of dropping rows. Bad data fails loud rather than quietly lying.

Pydantic + rate card

Byte-identical determinism

No analysis reads the wall clock: identical data renders byte-identical reports, which is what lets tests pin exact figures to the cent.

204 tests passing

Hardened surfaces

Allow-listed SQL scopes, sanitised logs that defeat log forging, SRI-pinned scripts and presence-only secret reporting.

Security built in

Accessible by design

Colour-blind-safe palette with labels too, AA contrast recorded per role, keyboard focus rings and reduced-motion support.

WCAG AA contrast
The engineering

Six sources in, ranked actions out.

A seven-stage pipeline turns raw provider usage into dollar-costed recommendations. Every stage is isolated, nothing is silently dropped, and money flows one way: raw tokens in, verbatim impact figures out.

01
Six sources
src/mock_gen.py · provider adapters
Two seeded mocks make demos reproducible forever, two key-free parsers take console-exported usage JSON so operators without admin credentials can feed it real spend today, and two live adapters paginate the official APIs.
02
Row validation
src/schema.py · Pydantic UsageRecord
Every row must satisfy a 17-column canonical schema: tokens split four ways, timestamps ordered, model known to the effective-dated rate card. Cross-field rules reject source-versus-derived cost drift above one dollar at the door.
03
Reject ledger
collect-and-report · G11 policy
Bad rows are never silently dropped: every failure is collected with its reason into a reject ledger. Strict mode raises one diagnostic listing them all; lenient mode skips, logs and reports.📦 Nothing vanishes quietly
04
Collision guard & merge
record_id signature check · latest-wins
Two rows sharing an ID but carrying different token counts raise immediately: the source key is too coarse and a row would be lost. Re-ingesting restates rather than duplicates, so scheduled pulls can never double-count.
05
Canonical store
DuckDB + Parquet · hardened query()
One embedded store is the single interface. Tools read the data layer, never each other. Queries run through allow-listed scopes with escaped identifiers: no interpolated user input near the engine.
06
Analysis tools
forecast · explorer · anomaly · back-test · report
Pure functions of the store: budget projections over active days, leave-one-out spike detection, a back-tester that replays the forecast with zero leakage, and a TL;DR briefing that classifies its own data as real or synthetic.
07
Actions & delivery
src/actions.py · SMTP Mondays 08:03
Report signals become ranked advisories with estimated dollar impact copied verbatim from the source signal, confidence, caveats and a declarative done-check describing how a human would verify completion.
src/anomaly.py (the spike detector)
# src/anomaly.py - leave-one-out baseline: a spike cannot inflate its own statistics
for i, (d, v) in enumerate(points):
    others   = vals[:i] + vals[i + 1:]     # exclude the day under test (A1)
    mean     = statistics.fmean(others)
    std      = statistics.pstdev(others)
    z        = dev / std if std > 0 else 0.0

    # an alert fires ONLY when BOTH conditions hold (spec D3)
    if z >= z_threshold and dev >= min_abs_usd:
        alerts.append({"date": d, "z": round(z, 2)})
# small relative blips never spam; large deviations always surface.
Independent by construction
Mock data emits a provider cost computed separately from the derived path, so reconciliation tests cannot pass circularly.
Deterministic outputs
Identical stores render byte-identical reports. Any change means something actually changed, which is what makes the automated Monday delivery trustworthy.
Advisory, honestly
Actions recommend and estimate but do not execute: closing the loop needs a state store, deferred deliberately rather than faked.
The stack

Boring where possible, rigorous where it counts.

An embedded analytics stack with no server component anywhere in the analysis path: everything runs from files a fresh checkout can regenerate.

Python
Language
Typed, testable pipeline code from adapters to report.
DuckDB
Analytics engine
Embedded SQL over Parquet: no server to run or secure.
Parquet
Storage
Columnar store of record, regenerable and cheap.
Pydantic
Validation
Row-level schemas with cross-field business rules.
pytest
Test gate
204 tests pinning exact fixture figures to the cent.
Chart.js
Dashboard
Pinned version, integrity-locked via SRI hash.
DuckDB SQL
Query layer
Allow-listed scopes and escaped identifiers only.
SMTP
Delivery
Weekly Monday 08:03 briefing, no-op when unconfigured.
Why it holds up

Evidence first, always.

Reconciled
Derived cost checked against provider-reported cost on every ingest, agreeing within a millionth of a dollar.
Deterministic
Same store, byte-identical output: regressions break loudly, changes mean something.
Fail-loud
Unknown models, ID collisions and drifted costs all stop the line with diagnostics.
Honest limits
The toolkit publishes what is verified versus not, including its own unverified adapters.
A functional demonstrator

See it running.

The full tech review is live as a standalone showcase site: every tool reviewed, the architecture drawn, and the proof figures reproducible from a fresh checkout with one command.

Token-Spend Toolkit
Case study · LLM spend analytics · Built & sponsored by AI Boffin Hub
Like what you see

Want your numbers this accounted for?

The Token-Spend Toolkit went from spec to a board-signed, audited production system. If you have AI spend, pipelines or pilots that need the same treatment, let's talk it through.

Fixed prices · Set against a written spec
Book a Production Consultation